Maintenance Control Dashboard
If not working correctly, please ensure JavaScript is enabled in your browser settings and refresh.
Skip to Dashboard
Take a look at some of the key outputs automatically generated to support maintenance and production planning.
Click on the icons or panels to view some examples of the many outputs available from this bespoke fleet planning modelling.
Other outputs include data which provides a historical audit trail of maintenance activities detailing events, dates, times and names.
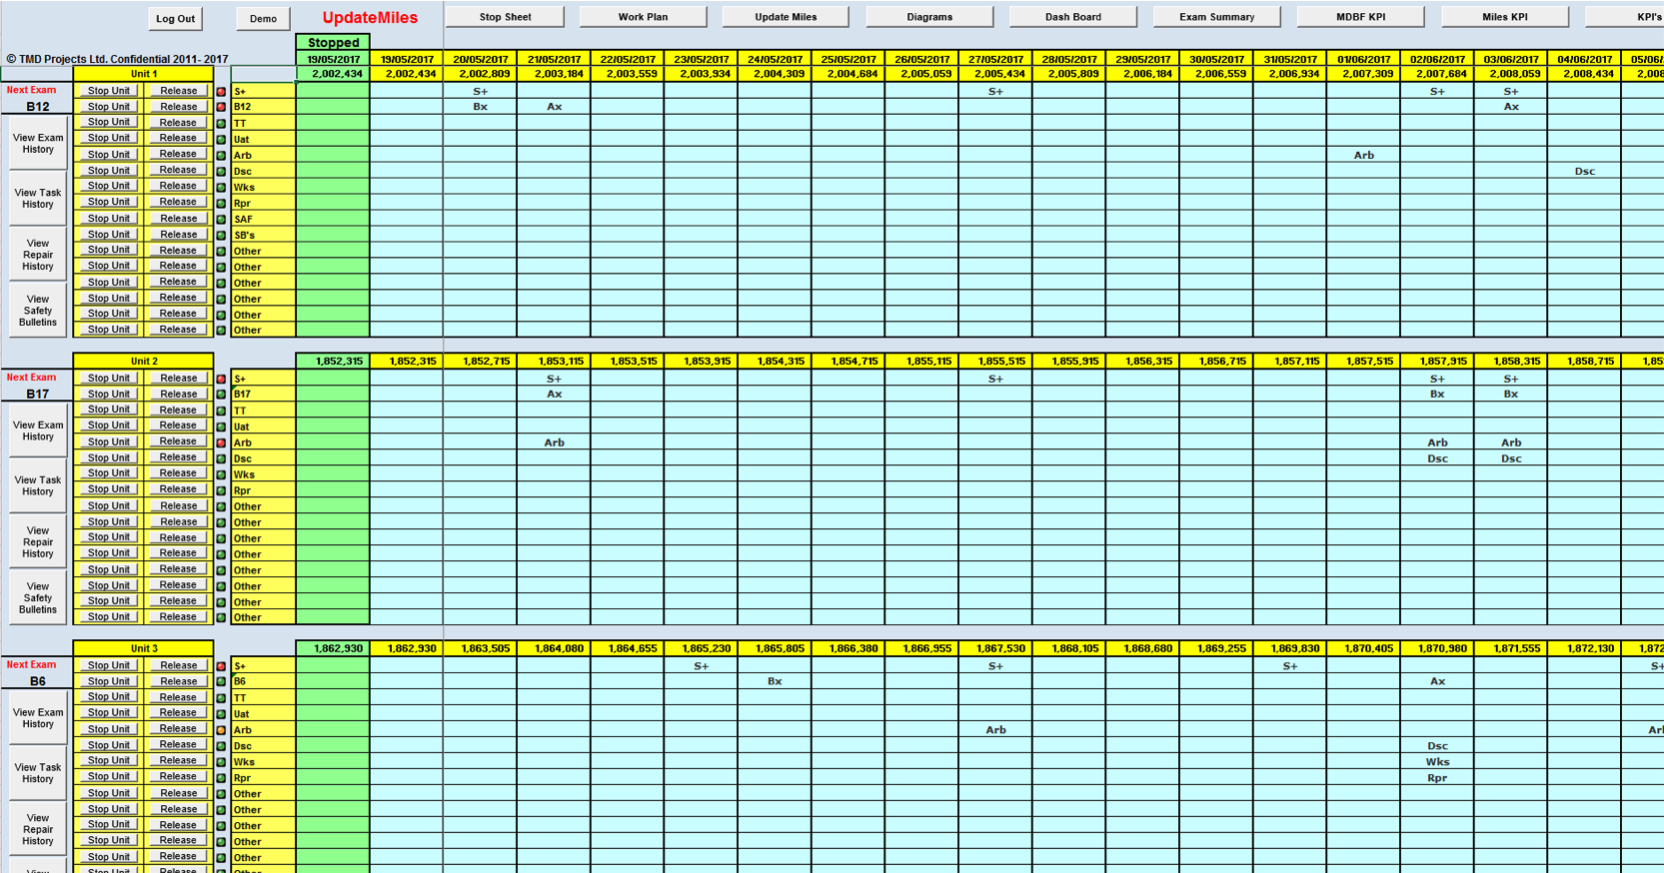
24/7 Stop Sheet
Exam History
Repairs History
Safety Bulletins
Okay, Got it.
View Maintenance Scheduling
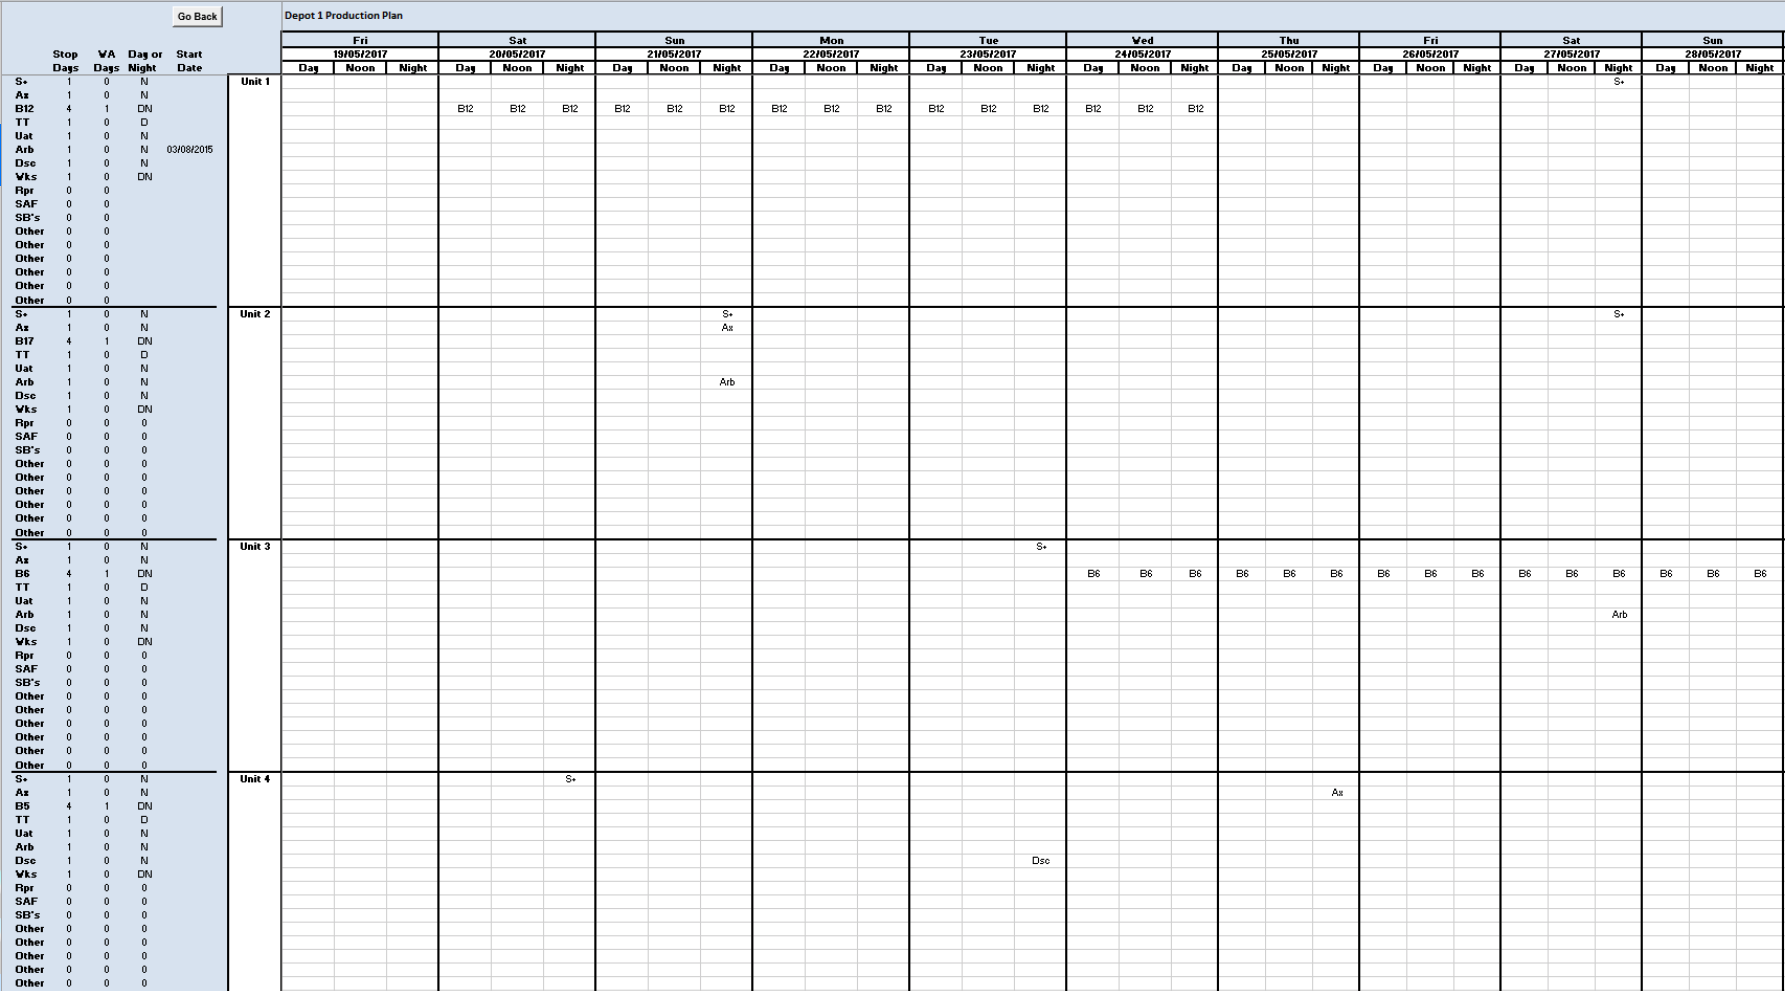
View Work Plan
View KPI's
View Exam Look-ahead Summary
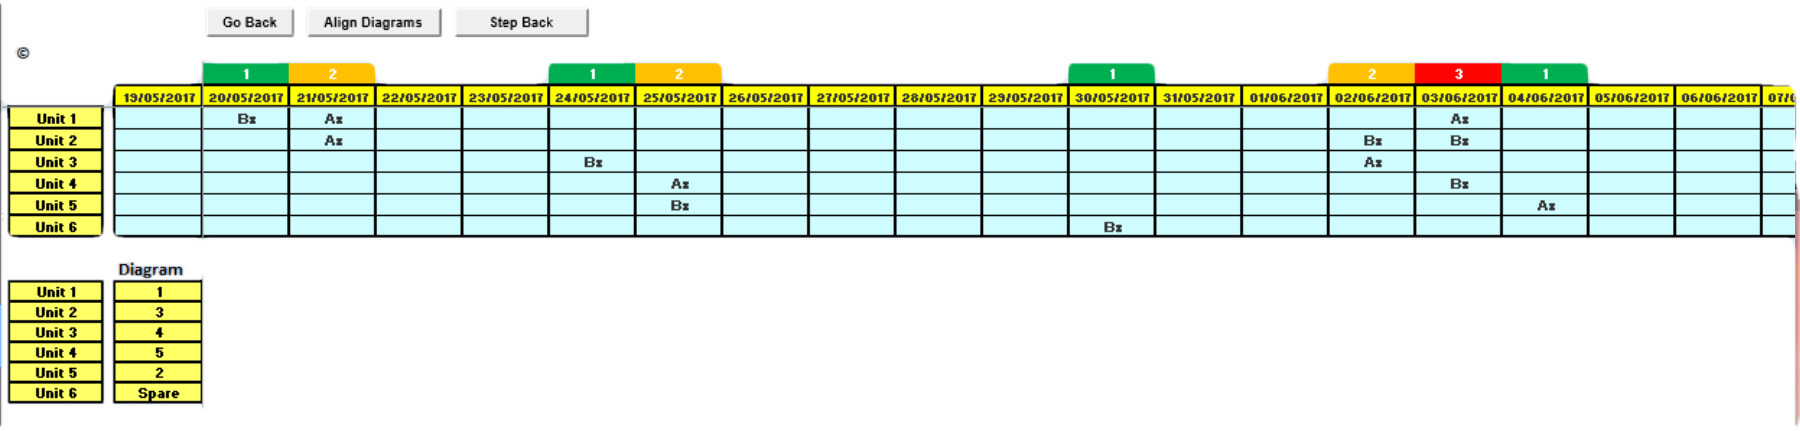
Maintenance Scheduling and Control
Production Plan
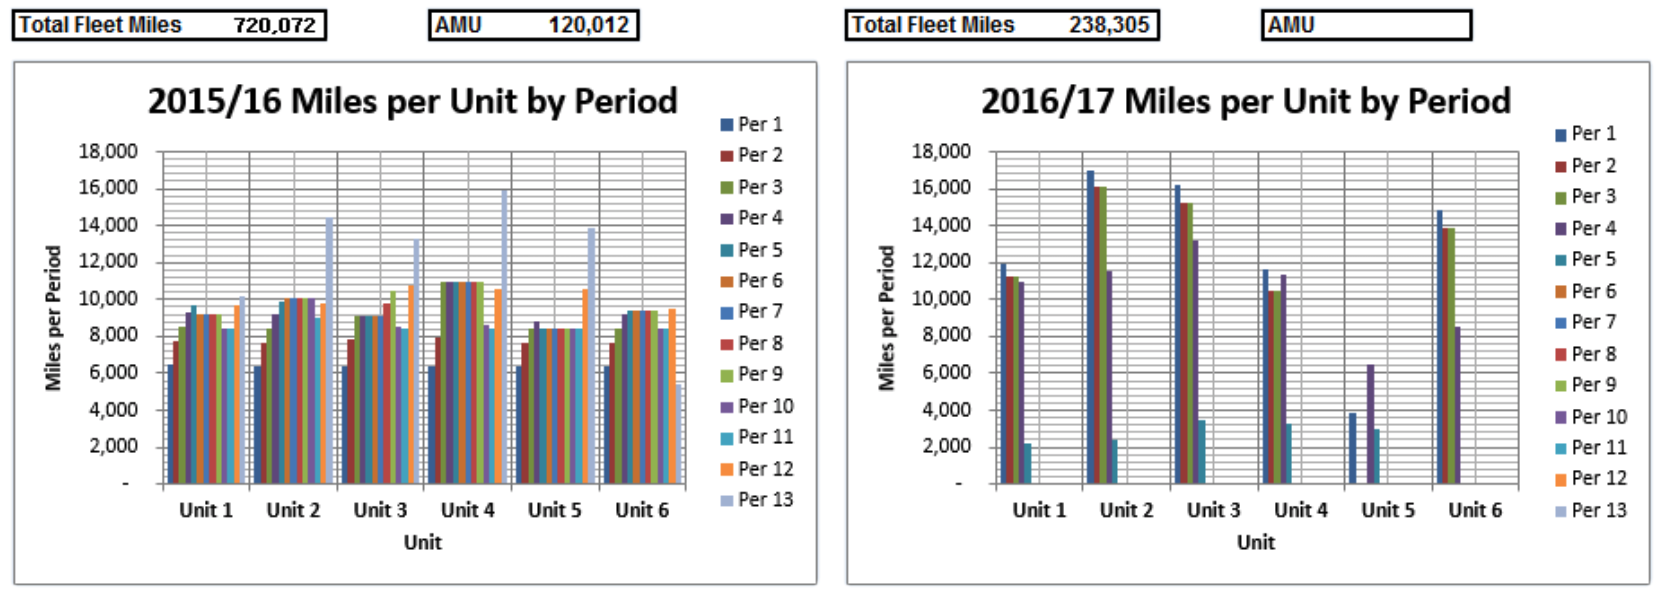
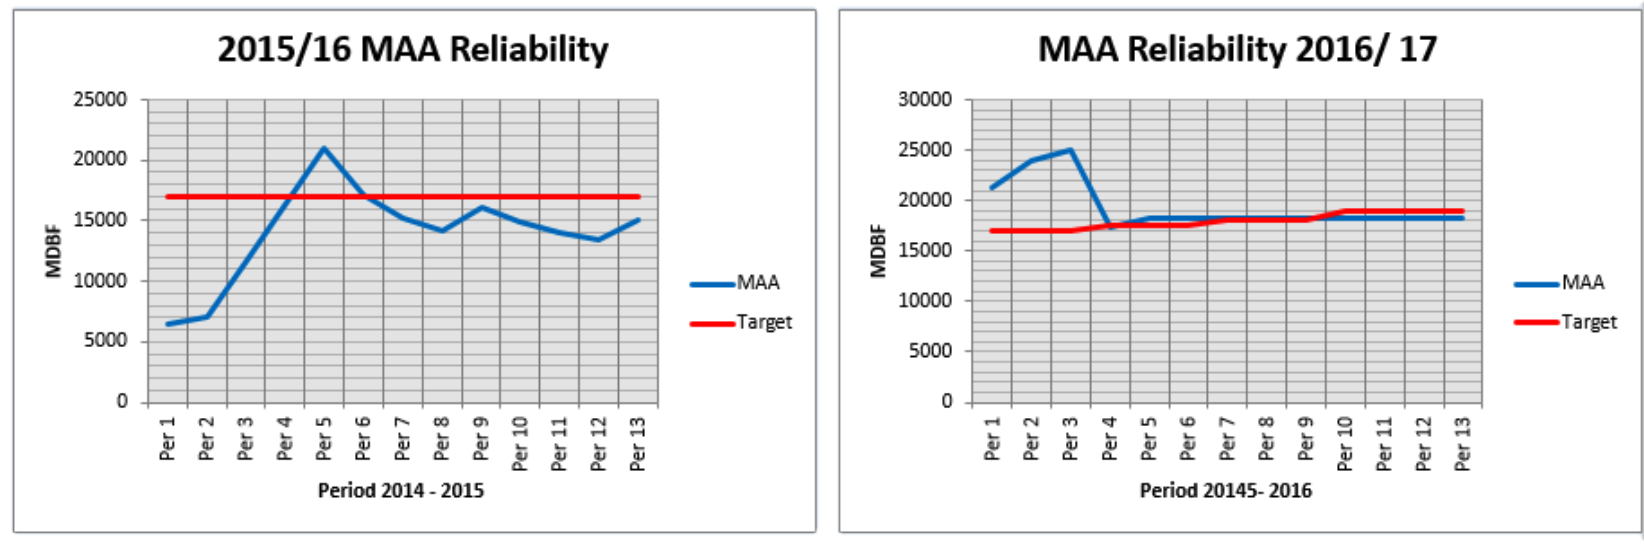
Key Performance Indicators
Miles per Unit by Period
MAA Reliability
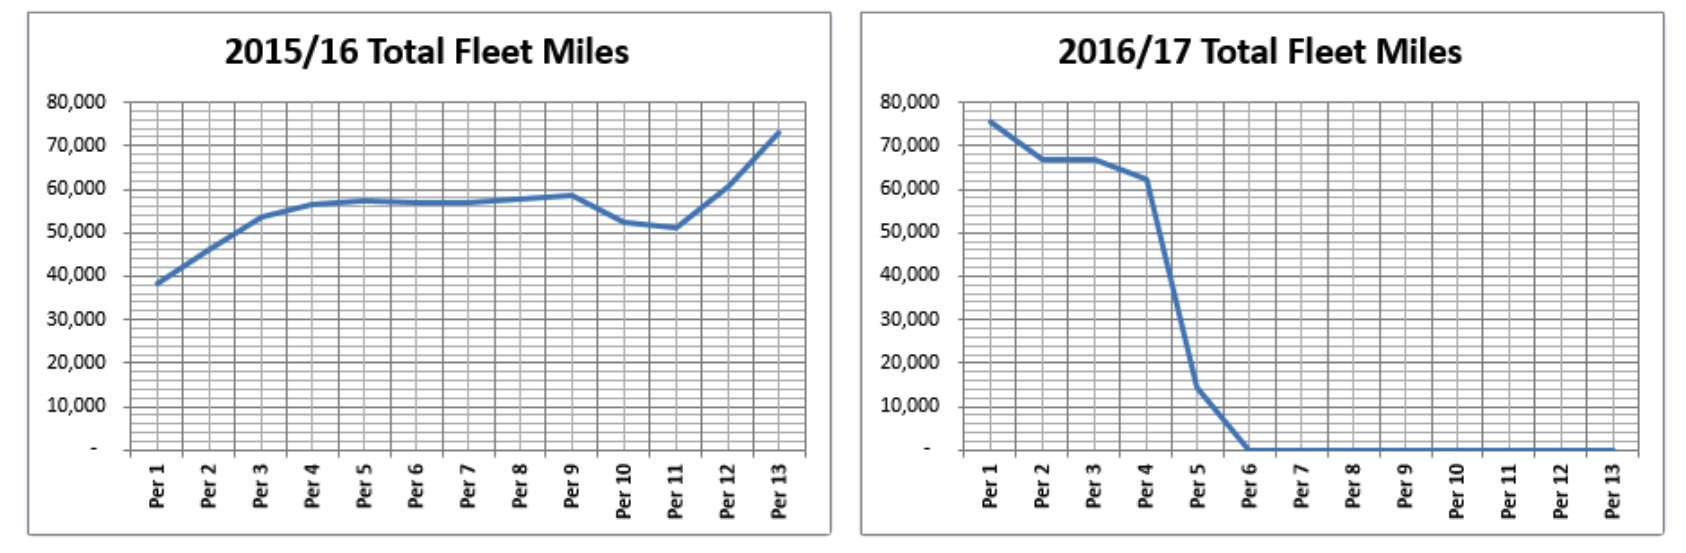
Fleet Mileage
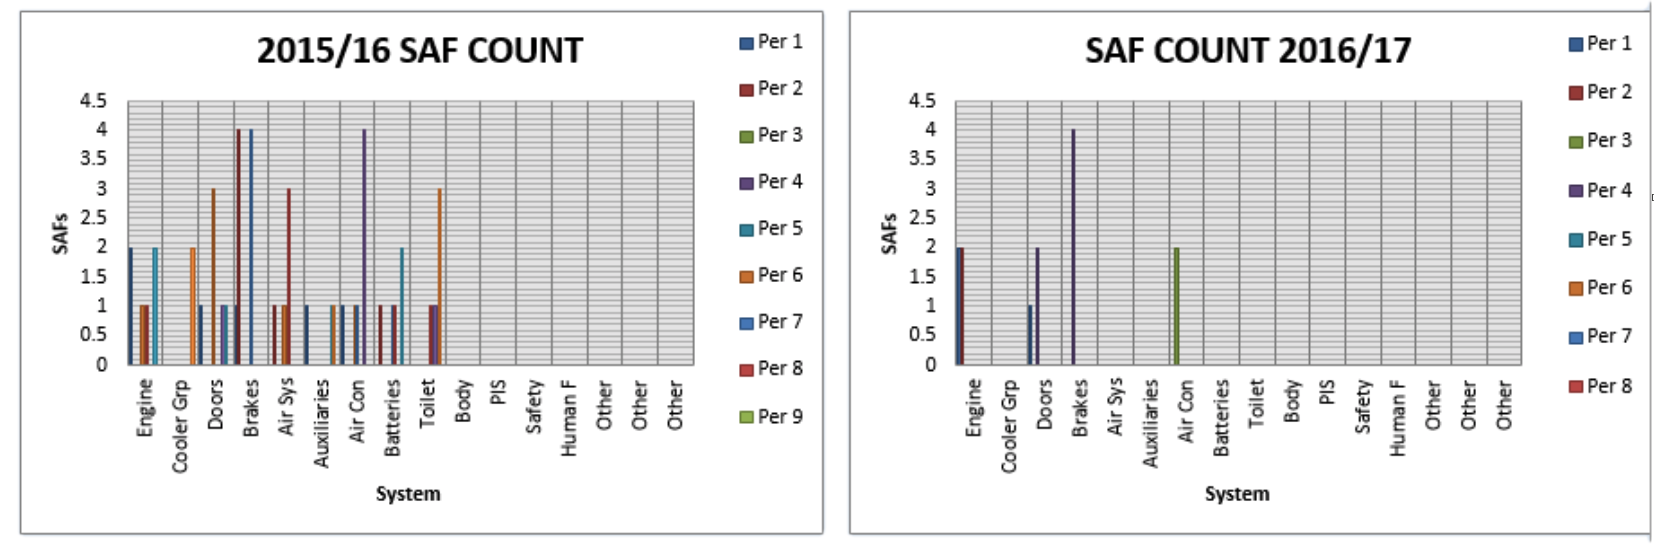
SAF Count
Take a look at the KPI comparison graphs by activating the icons above.
Exam look-ahead Summary
Provides a forward view of exam attrition and bunching.
Uses diagram mileages to control attrition and avoid too many exams at the same time.